Note
Go to the end to download the full example code.
Signal-to-Noise Ratio (SNR) Metric for Raw RF Data#
This example demonstrates how to:
Load raw RF data from the PICMUS dataset
Visualize the RF signal to identify regions of interest
Automatically detect signal and noise regions
(Optional) Manually adjust parameters based on what you see
Compute and print the RF SNR
This workflow uses real raw RF data from the PICMUS challenge dataset [1]. The SNR calculation follows standard ultrasound analysis practices, with automated region detection inspired by analysis tools like ultraspy [2].
References#
Example#
1. Import required modules and functions#
import matplotlib.pyplot as plt

from ultrasound_metrics.data.uff import inspect_dataset, load_dataset
from ultrasound_metrics.metrics.rf_snr import compute_rf_snr, find_signal_and_noise
2. Load the ultrasound dataset and extract raw RF data#
# Load raw RF data directly from the PICMUS dataset
dataset_info = inspect_dataset("picmus_resolution_experiment")
print(f"Dataset: {dataset_info['name']}")
print(f"Description: {dataset_info['description']}")

# Load raw RF data from channel_data
print("\n=== Loading Raw RF Data ===")
channel_data = load_dataset("picmus_resolution_experiment", key="/channel_data")
print(f"Raw channel data shape: {channel_data.shape}")
print(f"Raw channel data type: {channel_data.dtype}")

# Extract a single channel for RF SNR analysis
# Channel data shape: (samples, channels, frames)
samples, channels, frames = channel_data.shape
channel_idx = channels // 2  # Middle channel
frame_idx = 0  # First frame

# Extract single channel RF data
rf_data = channel_data[:, channel_idx, frame_idx]
print(f"Extracted RF data shape: {rf_data.shape}")
print(f"Channel index: {channel_idx} (out of {channels})")
print(f"Frame index: {frame_idx} (out of {frames})")
print(f"Number of samples: {samples}")
Dataset: picmus_resolution_experiment
Description: PICMUS challenge resolution/distortion test (experiment)

=== Loading Raw RF Data ===
Raw channel data shape: (3328, 128, 75)
Raw channel data type: float32
Extracted RF data shape: (3328,)
Channel index: 64 (out of 128)
Frame index: 0 (out of 75)
Number of samples: 3328
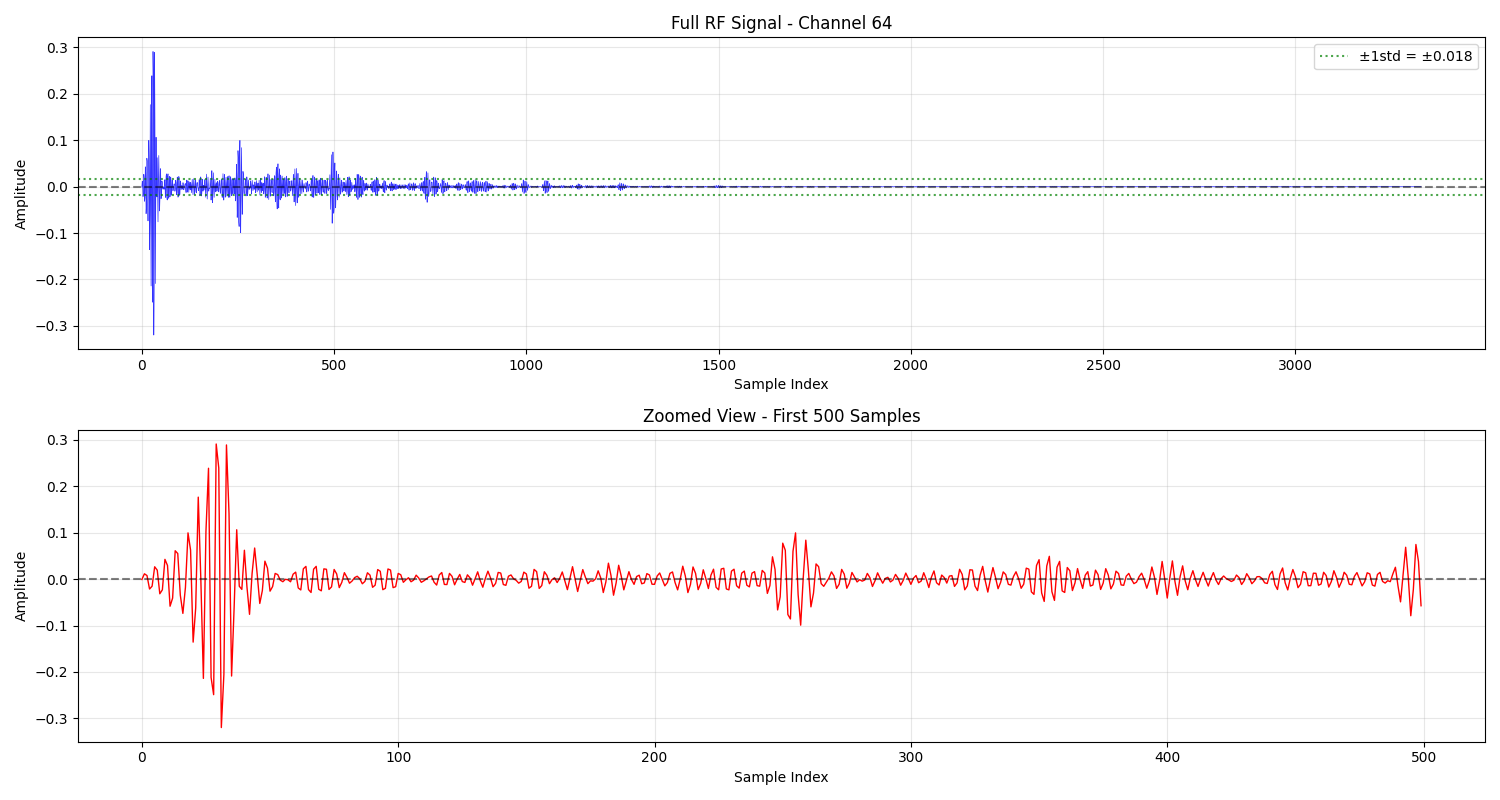
3. Visualize the RF data to help identify regions#
plt.figure(figsize=(15, 8))

# Plot the full RF signal
plt.subplot(2, 1, 1)
plt.plot(rf_data, "b-", linewidth=0.5, alpha=0.8)
plt.title(f"Full RF Signal - Channel {channel_idx}")
plt.xlabel("Sample Index")
plt.ylabel("Amplitude")
plt.grid(True, alpha=0.3)

# Add some reference lines to help identify regions
plt.axhline(y=0, color="k", linestyle="--", alpha=0.5)
plt.axhline(y=rf_data.std(), color="g", linestyle=":", alpha=0.7, label=f"±1std = ±{rf_data.std():.3f}")
plt.axhline(y=-rf_data.std(), color="g", linestyle=":", alpha=0.7)
plt.legend()

# Plot a zoomed view of the first 500 samples to see startup artifacts
plt.subplot(2, 1, 2)
zoom_samples = min(500, len(rf_data))
plt.plot(rf_data[:zoom_samples], "r-", linewidth=1)
plt.title(f"Zoomed View - First {zoom_samples} Samples")
plt.xlabel("Sample Index")
plt.ylabel("Amplitude")
plt.grid(True, alpha=0.3)
plt.axhline(y=0, color="k", linestyle="--", alpha=0.5)

plt.tight_layout()
plt.show()
4. Manual parameter adjustment based on visualization#
print("\n=== Manual Parameter Adjustment ===")
print("Based on the visualization above, you can adjust these parameters:")

# Current parameters - users can modify these based on what they see
ignore_until = 10  # Skip initial startup artifacts
signal_width = 50  # Width of signal region around maximum
noise_offset = 100  # Gap between signal and noise regions

print("Current parameters:")
print(f"- ignore_until: {ignore_until} (skip first {ignore_until} samples)")
print(f"- signal_width: {signal_width} (signal region width)")
print(f"- noise_offset: {noise_offset} (gap between signal and noise)")

print("\nTo adjust these parameters:")
print("1. Look at the RF signal plot above")
print("2. Identify where startup artifacts end (usually first 50-200 samples)")
print("3. Modify the 'ignore_until' parameter below")
print("4. Re-run the analysis")
=== Manual Parameter Adjustment ===
Based on the visualization above, you can adjust these parameters:
Current parameters:
- ignore_until: 10 (skip first 10 samples)
- signal_width: 50 (signal region width)
- noise_offset: 100 (gap between signal and noise)

To adjust these parameters:
1. Look at the RF signal plot above
2. Identify where startup artifacts end (usually first 50-200 samples)
3. Modify the 'ignore_until' parameter below
4. Re-run the analysis
5. Automatic region detection with user-defined parameters#
print("\n=== Automatic Region Detection ===")
print(f"Using parameters: ignore_until={ignore_until}, signal_width={signal_width}, noise_offset={noise_offset}")

signal_data_auto, noise_data_auto = find_signal_and_noise(
    rf_data, signal_width=signal_width, noise_offset=noise_offset, ignore_until=ignore_until, show=True
)

# Get the automatic region boundaries (approximate calculation)
# Note: This is an approximation since find_signal_and_noise doesn't return exact indices
auto_signal_samples = len(signal_data_auto)
auto_noise_samples = len(noise_data_auto)

print("\nAutomatic region summary:")
print(f"- Signal: {auto_signal_samples} samples")
print(f"- Noise: {auto_noise_samples} samples")
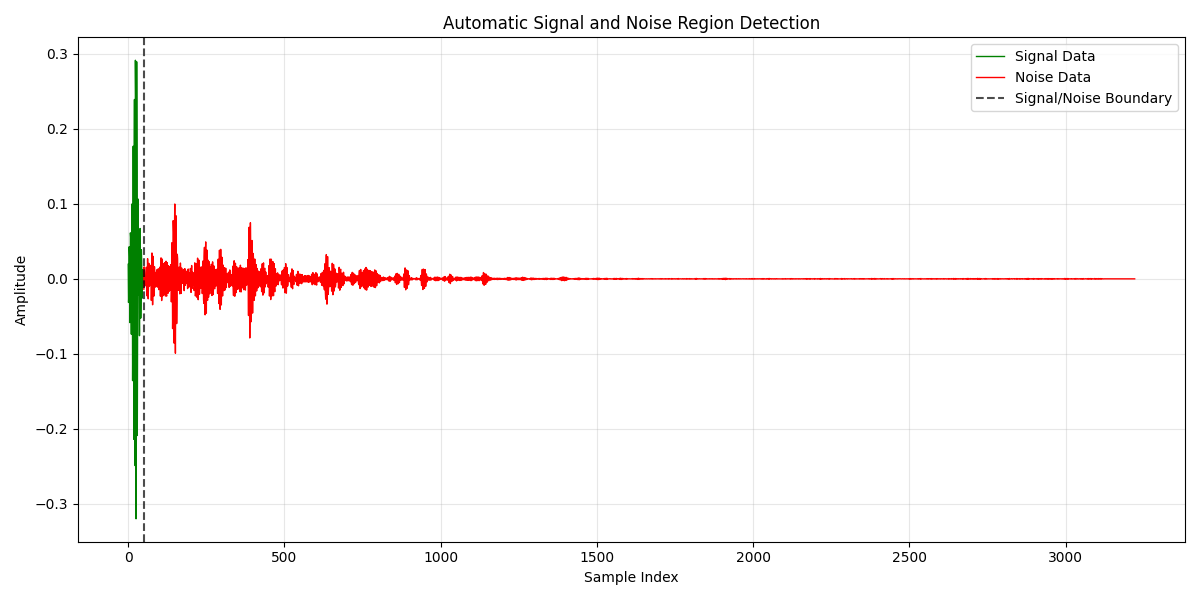
=== Automatic Region Detection ===
Using parameters: ignore_until=10, signal_width=50, noise_offset=100

Automatic region summary:
- Signal: 50 samples
- Noise: 3172 samples
6. Manual adjustment of automatic regions (OPTIONAL)#
print("\n=== Manual Adjustment of Automatic Regions ===")
print("The automatic detection may not capture the ideal regions.")
print("You can manually adjust the bounds based on what you see in the plot above.")

# Manual adjustment parameters (modify these based on visualization)
print("\n=== Manual Adjustment Parameters ===")
print("Modify these values based on the visualization above:")

# Example: Restrict noise to samples up to the 200th sample
manual_signal_start = 20  # Start of signal region (big spike)
manual_signal_end = 40  # End of signal region
manual_noise_start = 40  # Start of noise region
manual_noise_end = 200  # Limit noise region to first 200 samples

print("Manual adjustments:")
print(f"- Signal: samples {manual_signal_start}-{manual_signal_end} (manual selection)")
print(f"- Noise: samples {manual_noise_start}-{manual_noise_end} (limited to 200)")

# Extract manually adjusted regions
signal_data = rf_data[manual_signal_start:manual_signal_end]
noise_data = rf_data[manual_noise_start:manual_noise_end]

print("\nAdjusted regions:")
print(f"- Signal: {len(signal_data)} samples")
print(f"- Noise: {len(noise_data)} samples")
=== Manual Adjustment of Automatic Regions ===
The automatic detection may not capture the ideal regions.
You can manually adjust the bounds based on what you see in the plot above.

=== Manual Adjustment Parameters ===
Modify these values based on the visualization above:
Manual adjustments:
- Signal: samples 20-40 (manual selection)
- Noise: samples 40-200 (limited to 200)

Adjusted regions:
- Signal: 20 samples
- Noise: 160 samples
7. Print region summary#
signal_samples = len(signal_data)
noise_samples = len(noise_data)

print("\n=== Region Selection Summary ===")
print(f"Signal region: {signal_samples} samples (manually adjusted)")
print(f"Noise region: {noise_samples} samples (manually adjusted)")
=== Region Selection Summary ===
Signal region: 20 samples (manually adjusted)
Noise region: 160 samples (manually adjusted)
8. Print basic statistics#
print("\n=== Region Statistics ===")
print(f"Signal mean: {signal_data.mean():.3f}")
print(f"Signal std: {signal_data.std():.3f}")
print(f"Noise mean: {noise_data.mean():.3f}")
print(f"Noise std: {noise_data.std():.3f}")
=== Region Statistics ===
Signal mean: -0.006
Signal std: 0.190
Noise mean: 0.000
Noise std: 0.018
9. Compute and print RF SNR#
snr_db = compute_rf_snr(signal_data, noise_data, show=True)

print("\n=== RF SNR Results ===")
print(f"RF SNR: {snr_db:.2f} dB")
print("Data source: Raw RF data from /channel_data (manually adjusted regions)")
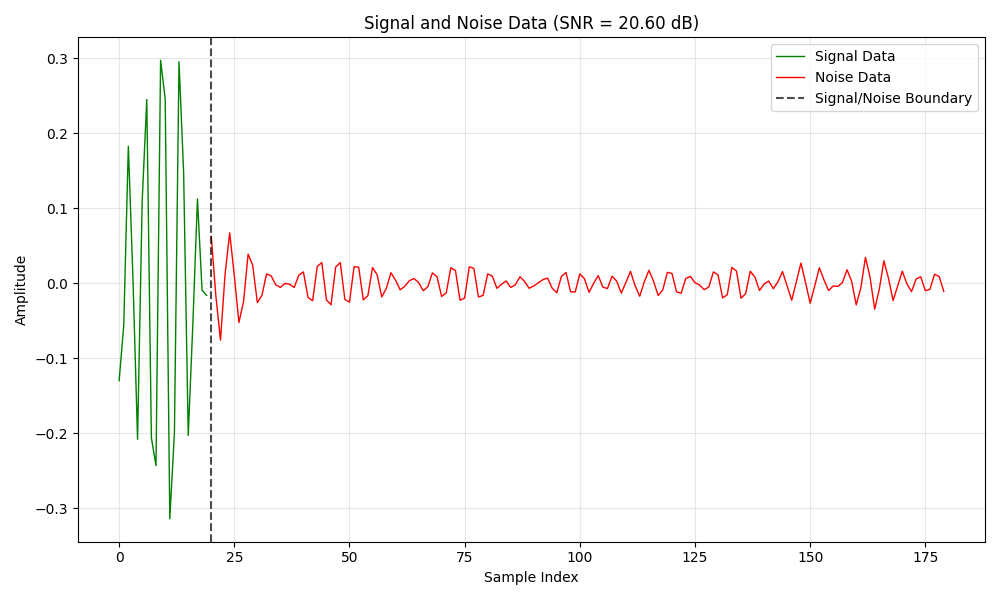
=== RF SNR Results ===
RF SNR: 20.60 dB
Data source: Raw RF data from /channel_data (manually adjusted regions)
10. Compare different SNR calculation methods#
print("\n=== SNR Method Comparison ===")

# Standard SNR (centered, average power)
snr_standard = compute_rf_snr(signal_data, noise_data, center=True, max_power=False)
print(f"Standard SNR (centered, avg power): {snr_standard:.2f} dB")

# SNR with max power
snr_max_power = compute_rf_snr(signal_data, noise_data, center=True, max_power=True)
print(f"SNR with max power: {snr_max_power:.2f} dB")

# SNR without centering
snr_uncentered = compute_rf_snr(signal_data, noise_data, center=False, max_power=False)
print(f"SNR without centering: {snr_uncentered:.2f} dB")
=== SNR Method Comparison ===
Standard SNR (centered, avg power): 20.60 dB
SNR with max power: 24.96 dB
SNR without centering: 20.60 dB
Total running time of the script: (0 minutes 0.465 seconds)